Unit 1: Introduction
Explore common data tasks like finding the average, inspecting data, and more. Learn about the data types you might be analyzing, including numerical and categorical data, and understand how they might affect your analysis.
8 Lessons:
1. Welcome
2. What is Data Analysis?
3. Python Refresher
4. Start Your Analysis
5. Back to Python
6. Review
7. Quiz
8. Lab: Exploring Real Data
Unit 2: Graphs
Learn how to do the basics: create histograms, bar charts, line graphs and scatter plots using Matplotlib. Understand how and why to use each kind of graph through guided projects. Finally, use data from NASA to visualize the monthly rainfall in your hometown.
11 Lessons:
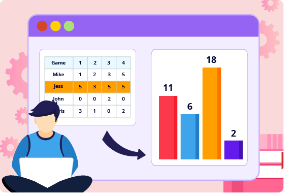
9. Bar Graphs and Histograms
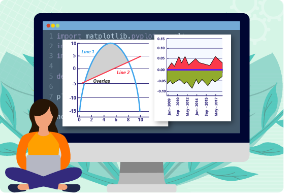
10. Line Graphs
11. Scatter Plots
12. Customizing Plots
13. Review
14. Quiz
15. Lab
Unit 3: DataFrames
Explore how to work with DataFrames, a datatype foundational to the Pandas library. Learn how to narrow your analysis to a particular set of data of interest without deleting any underlying data. Then put these skills to the test by organizing and graphing data about your favorite Olympic medal victories.
7 Lessons:
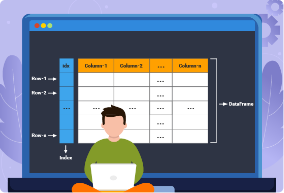
16. Creating Dataframes
17. Creating Random Data
18. Manipulating Data Sets
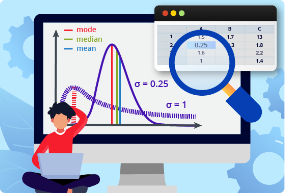
19. Variation of a Normal Curve
20. Review
21. Quiz
22. Lab: Olympics Medals
Unit 4: Complex Charts
In this unit, you’ll deep dive into charting and explore more data visualization types, including box charts, pie charts, and donut plots. You’ll further build your data organization skills by learning about pivot tables and grouping data.
9 Lessons:
23. Box Plots
24. Area Plots
25. Lab: Sea Level Anomaly
26. Creating Figures
27. Customizing Figures
28. Complex Bar Graphs
29. Pie Charts
30. Review
31. Quiz
Unit 5: Capstone Project
In this final, open-ended challenge, you’ll create your own original data analysis, from start-to-finish. Find a data set and perform initial analysis and clean-up, then create your own original visualizations from scratch!
5 Lessons:
32. Day 1: Intro to Final Lab
33. Day 2: Load Data, Initial Charts
34. Day 3: Charts Complete
35. Day 4: Polish, Customize, Document
36. Day 5: Final Report